-
 4.0
4.0
The SIGnaling Network
Open Resource
User Guide SIGNORApp
Introduction
Get ready to use the SIGNORApp
Search modes
Visualization modes and legend
PTM decomposition
Introduction
About the Team
Signor is a resource that annotates experimental evidence of causal interactions between proteins and other biological entities of biological relevance: stimuli, phenotypes, enzyme inhibitors, complexes, protein families etc. Each entry points to the experimental evidence supporting the interaction and is enriched by additional relevant metadata such as the effect of the interaction on the activity of the target entity, the molecular mechanism underlying this effect, etc… The curated data can be displayed as signed directed graphs by a graph drawing tool.
The SIGNOR project is developed at the University of Tome, Tor Vergata and supported by the Italian Association for Cancer Research and Human Technopole (please visit link).
Citing SIGNOR
Licata L et al SIGNOR 2.0, the SIGnaling Network Open Resource 2.0: 2019 update. Nucleic Acids Res. 2020 Jan 8;48(D1):D504-D510. doi: 10.1093/nar/gkz949.
SIGNORApp
SIGNORApp is a Cytoscape 3 application that provides access to causal interactions data annotated in the SIGNOR resource. It builds networks shaped as weighted directed graphs, where nodes are interacting entities (mainly proteins, but also protein complexes, phenotypes, chemicals…) and edges represent causal interactions supported by published experimental evidence.
Users can 1) query the dataset with single or multiple entity name(s) or identifier(s) and optionally include their interacting partners in the resulting network, by using three levels of complexity: ‘all interactions’, ‘connect entities in the list’, ‘connect by including bridge entities’; 2) browse pathways that have been manually annotated in SIGNOR; 3) extract the full interactome. The app offers two visualization options: the first only displays interactions between the entities while a second one that emphasizes post translational modifications occurring as a consequence of the interactions. In addition, users can click on nodes and edges to access entity and interaction information. Data is available for three model organisms: H. sapiens, M. musculus and R. norvegicus.
Get ready to use the SIGNORApp
Make sure you have Cytoscape installed. If not, please follow the instructions on the Cytoscape web site. Please note that SIGNORApp is optimized for Cytoscape 3.
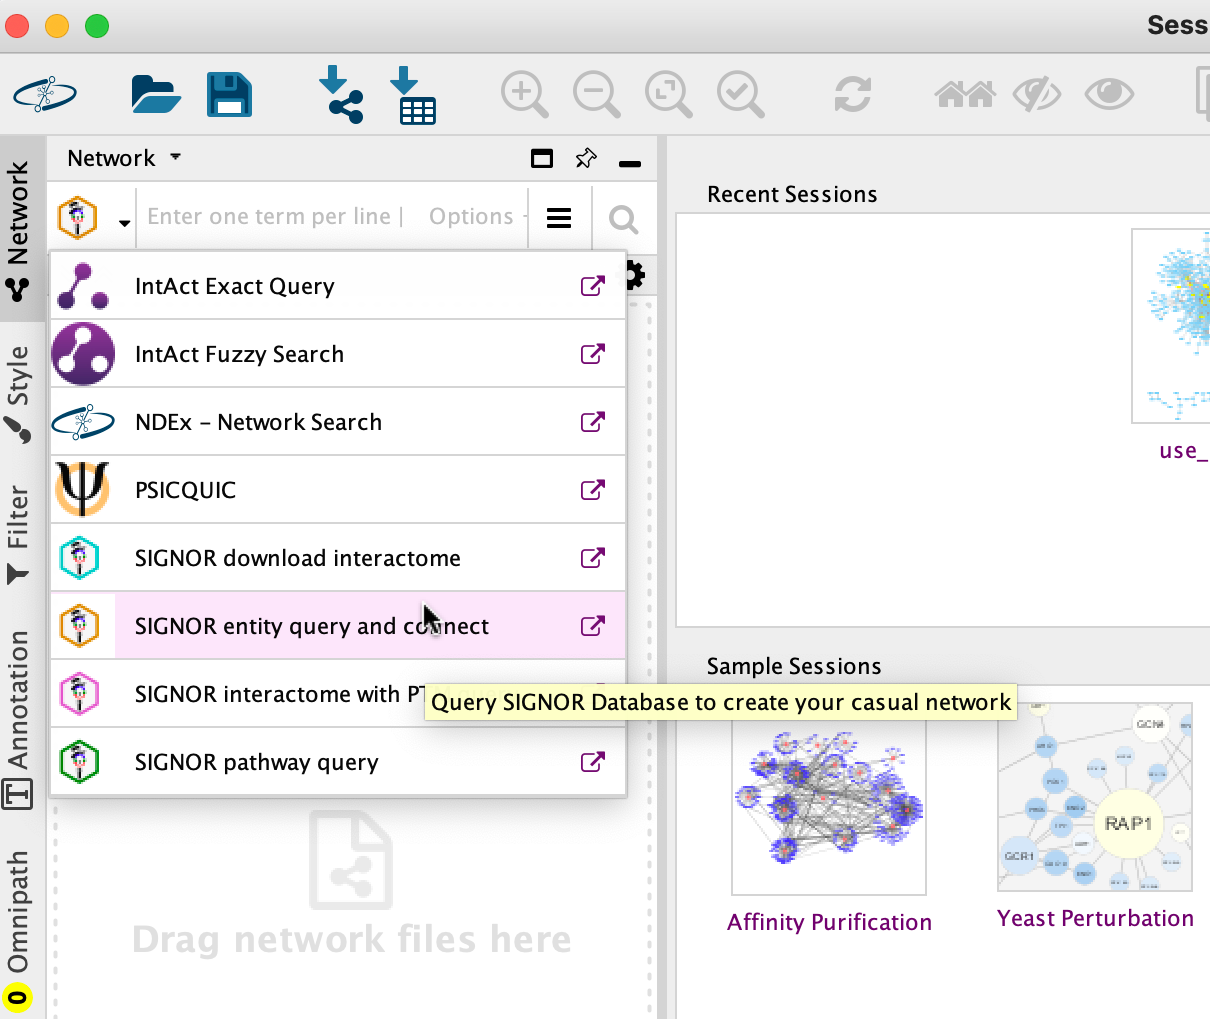
Figure 1 SIGNORApp search tools
Search modes
The SIGNORApp allows four query modes:
SIGNOR entity query and connect
To use this query mode, you should go to Control Panel –> Network–> SIGNOR entity query and connect
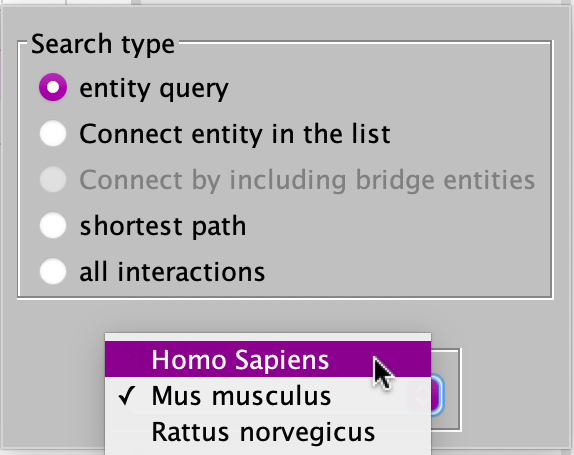
This search type allows the user to build a SIGNOR network associated with user-provided input which can be a single specific entity or a list of entities. Data is available for three model organisms: H. sapiens, M. musculus and R. norvegicus, which can be selected by choosing on the dropdown list (Fig. 2). As shown in Figure 2, five query types are allowed:
Figure 2 ‘SIGNOR entity query and connect’ panel.
To use this query mode, you should go to Control Panel –> Network–> SIGNOR entity query and connect. Next, click on and select the ‘entity query’ radio button and the species from the drop-down menu (Fig.2).
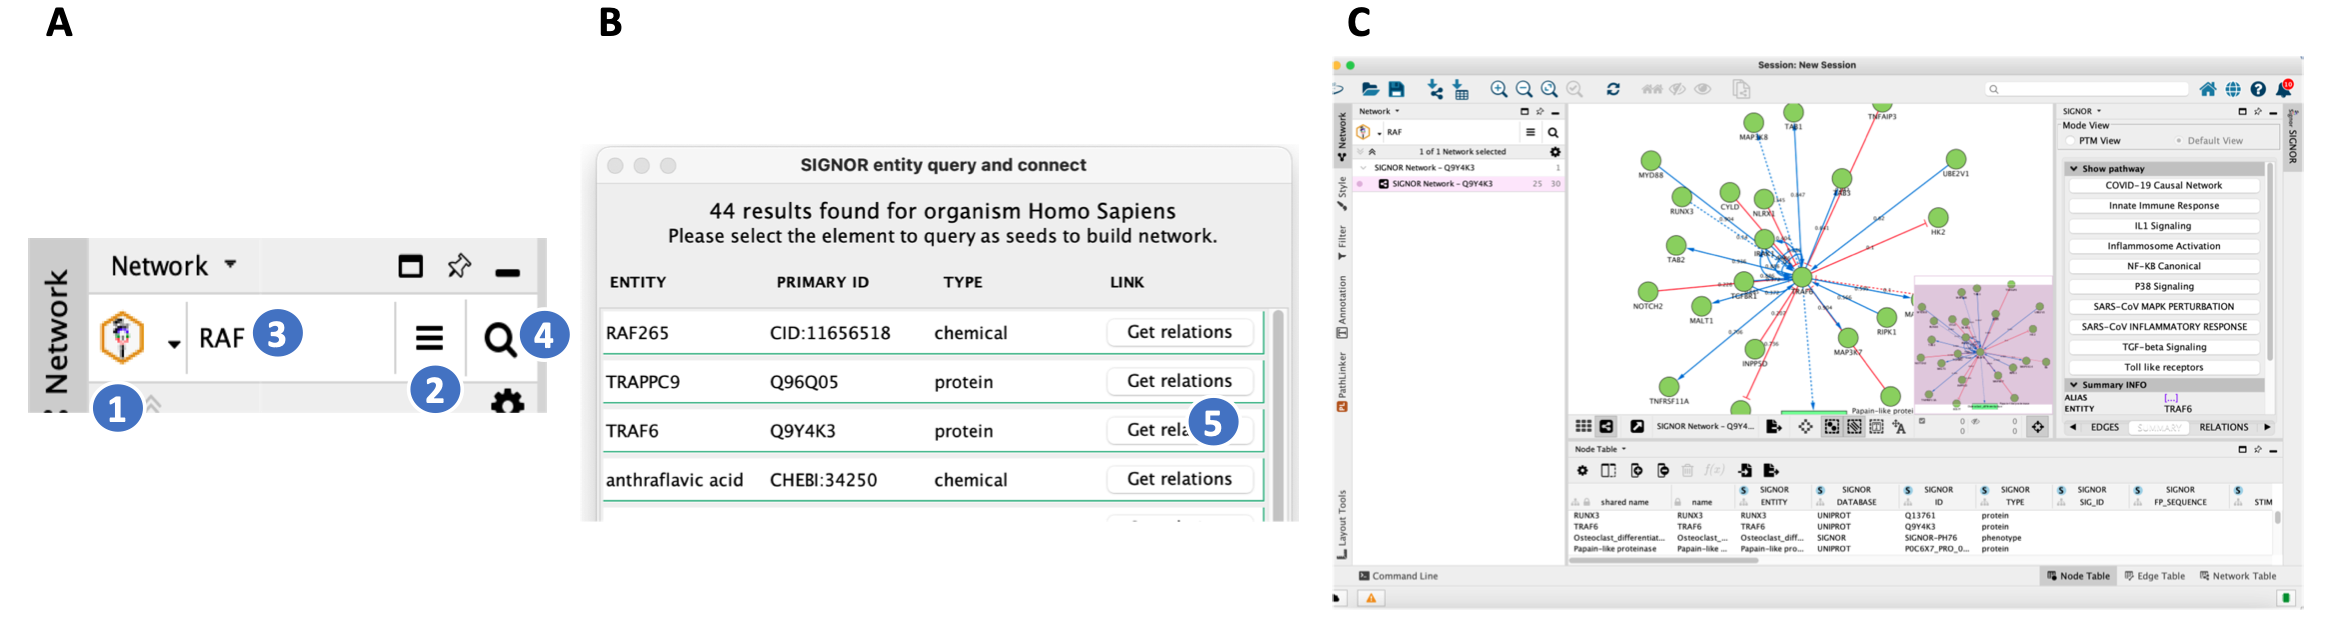
Once you have chosen the species and the query type (‘entity query’), you can enter the term you want to search for in the “search” bar. This can be an entity name (e.g. ‘TRAF6’ or ‘Apoptosis’), or part of it (e.g. ‘RAF’ or ‘Apop’) or an identifier (e.g. Q9Y4K3 or SIGNOR-PH1).
When your query is ready, click on or press Ctrl + Enter (Cmd + Enter on MacOS) (Fig. 3A).
The algorithm returns a list of candidate interactors that meet the query. You need to resolve the ambiguity and select the entity you are interested in that will be used to build the resulting network (Fig. 3B). By clicking on ‘Get relations’ you will be re-directed to the result page (Fig. 3C).
Figure 3 Example of a ‘entity query’ for the protein TRAF6. To perform an ‘entity query’ (1) make sure you have selected the ‘SIGNOR entity query and connect’ option in the control panel (Orange icon); (2) make sure you have selected ‘entity query’ radio button and ‘homo sapiens’ for the species; (3) type the query in the search box (e.g. part of the name: RAF); (4) launch the query by clicking on the magnifier symbol; (5) select TRAF6 and click on ‘Get relations’ to visualize results.
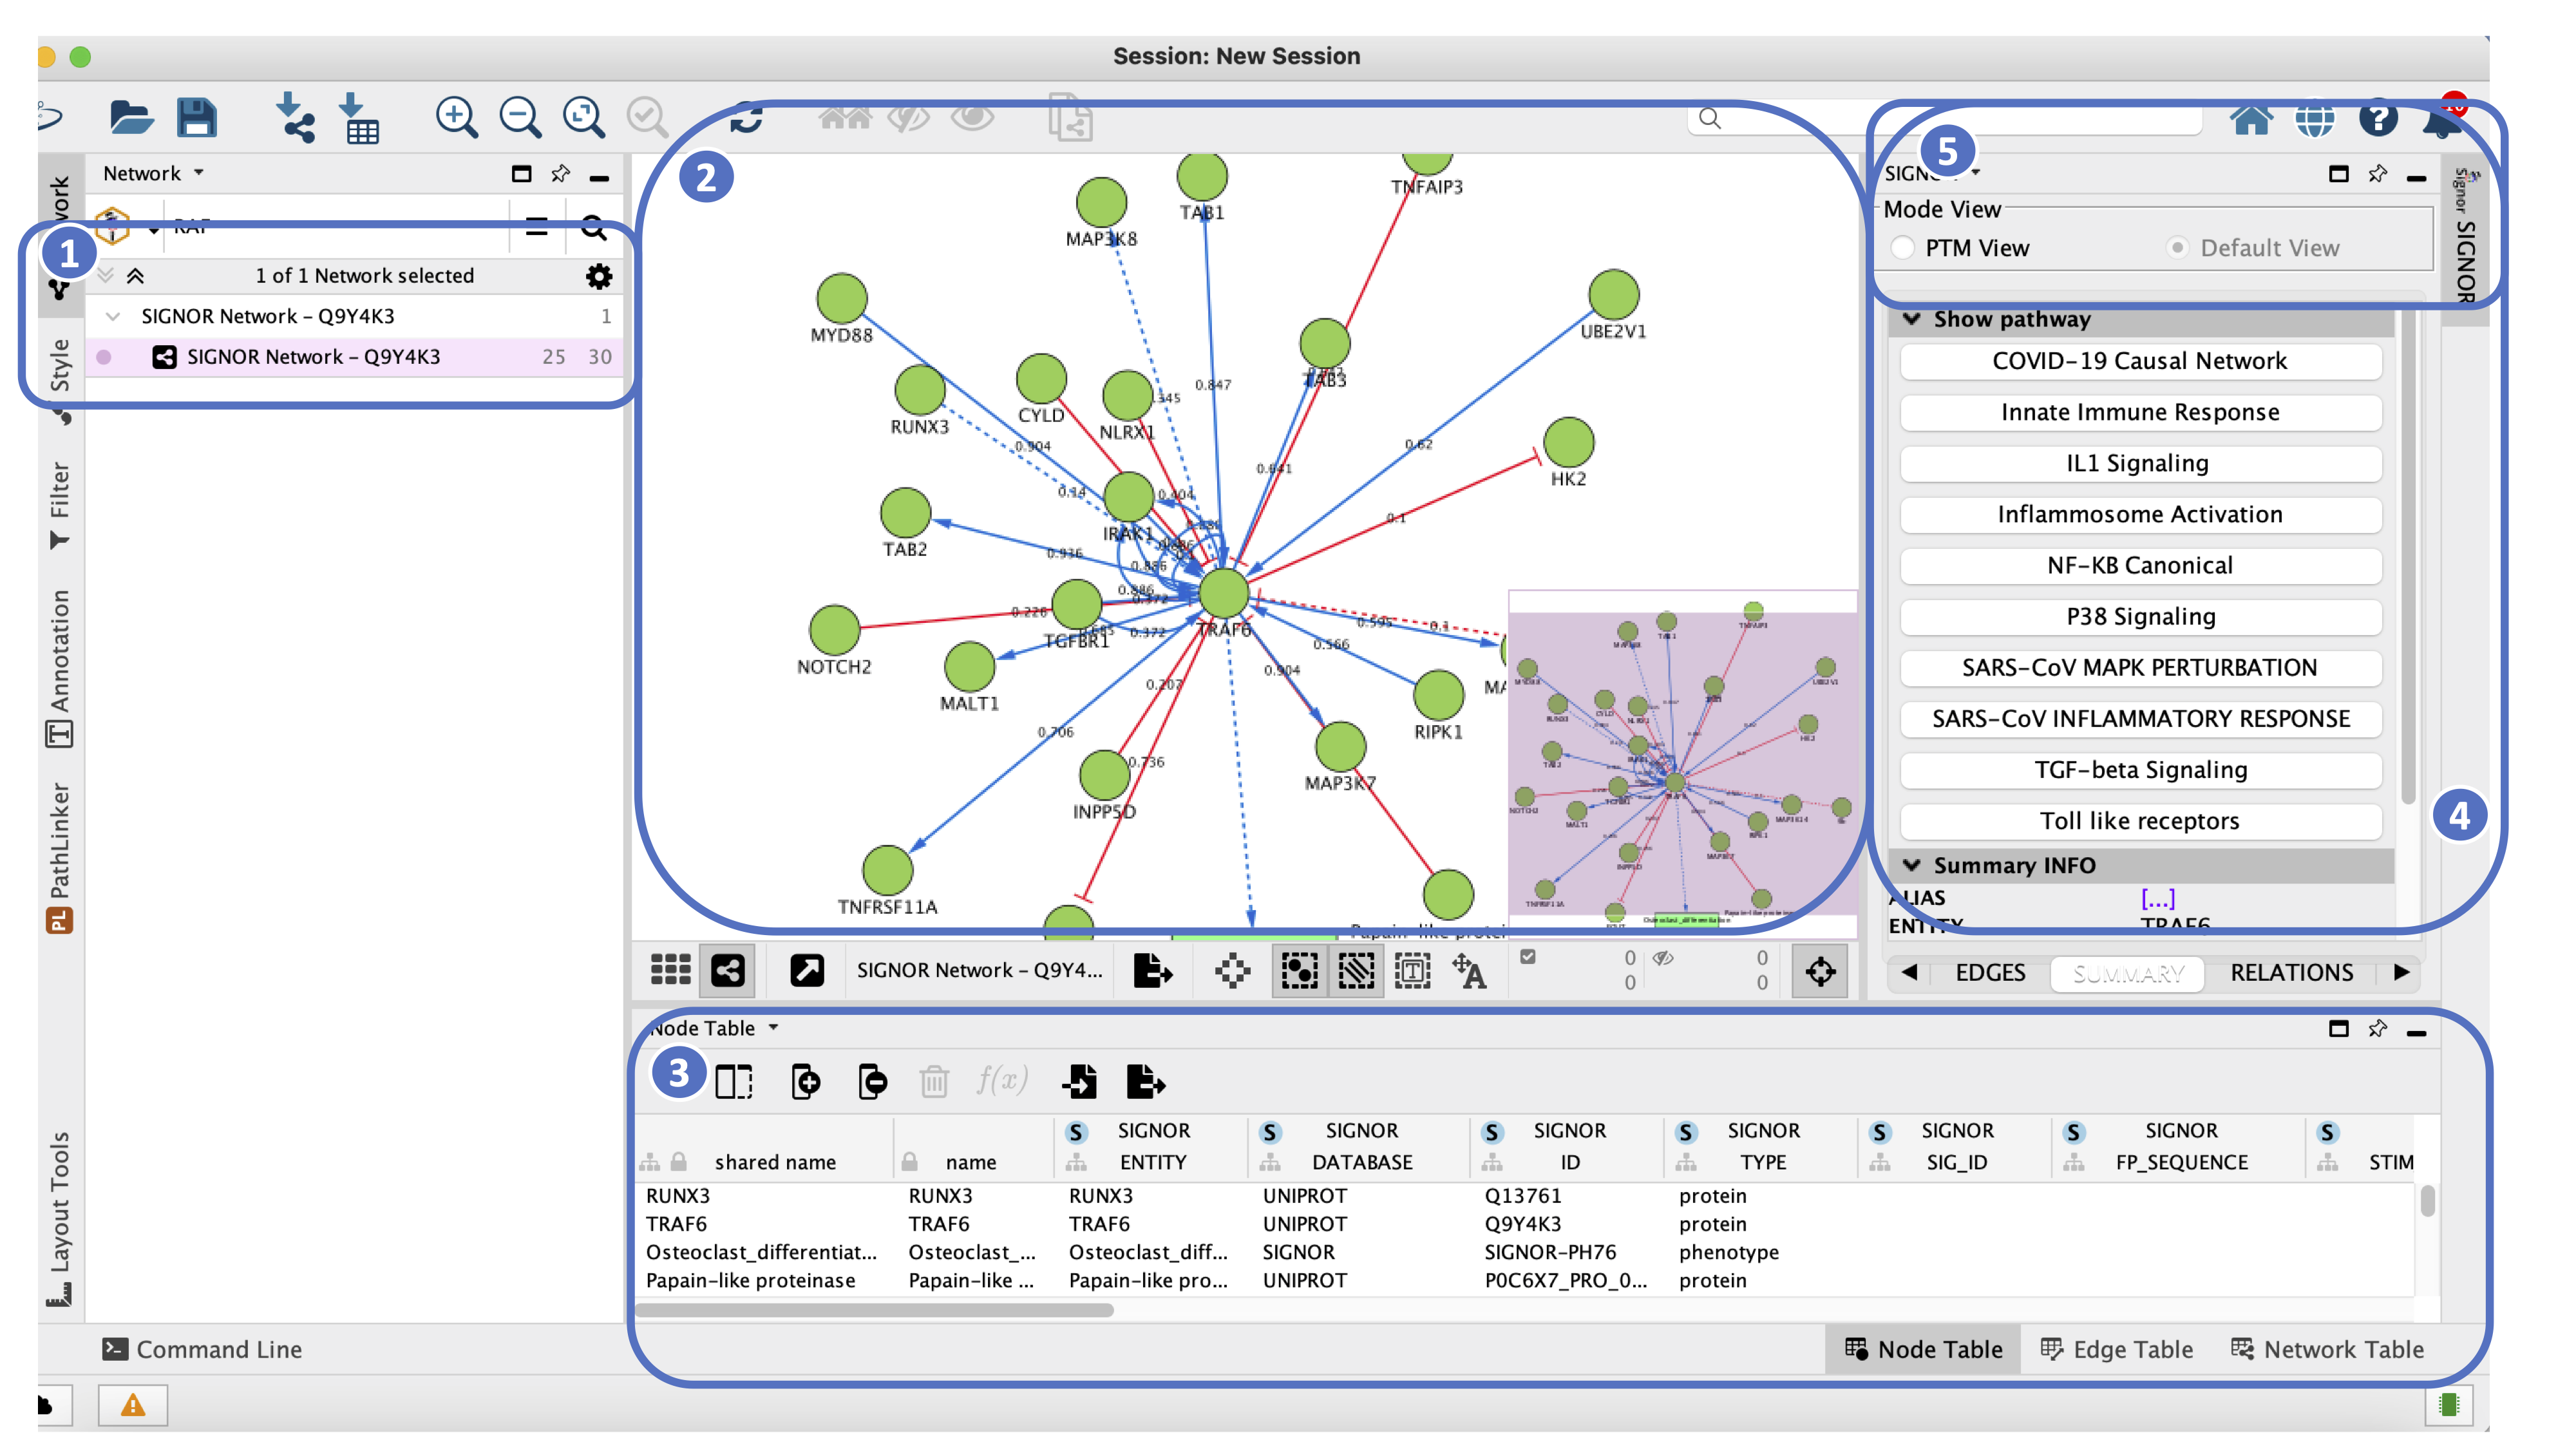
As shown in Figure 4, the results page is organized in four panels: the Network panel listing the networks and reporting their size(Fig. 4-1) ; the Visualization panel (Fig. 4-2) showing the interactions as a weighted directed graph where the shapes and colours of nodes and edges mirror the style in the web resource (Also described in the Default mode section); the Table panel (Fig. 4-3) which provides all the metadata associated to the network, fully reflecting the data in the original resource; the Results panel (Fig.4-4) which is organized to highlight node and the edge annotation and permits to switch between the ‘Default View’ and the ‘PTM view’ (Fig 4-5). The ‘PTM view’ mode is fully described in the Sections PTM view and PTM decomposition.
Figure 4 Results page for TRAF6 (Fig.3). (1) Network panel with the summary of the network. (2) The Visualization panel. (3) the Table panel. (4) the Results panel. (5) the view mode adopted (between the ‘Default View’ and the ‘PTM view’).
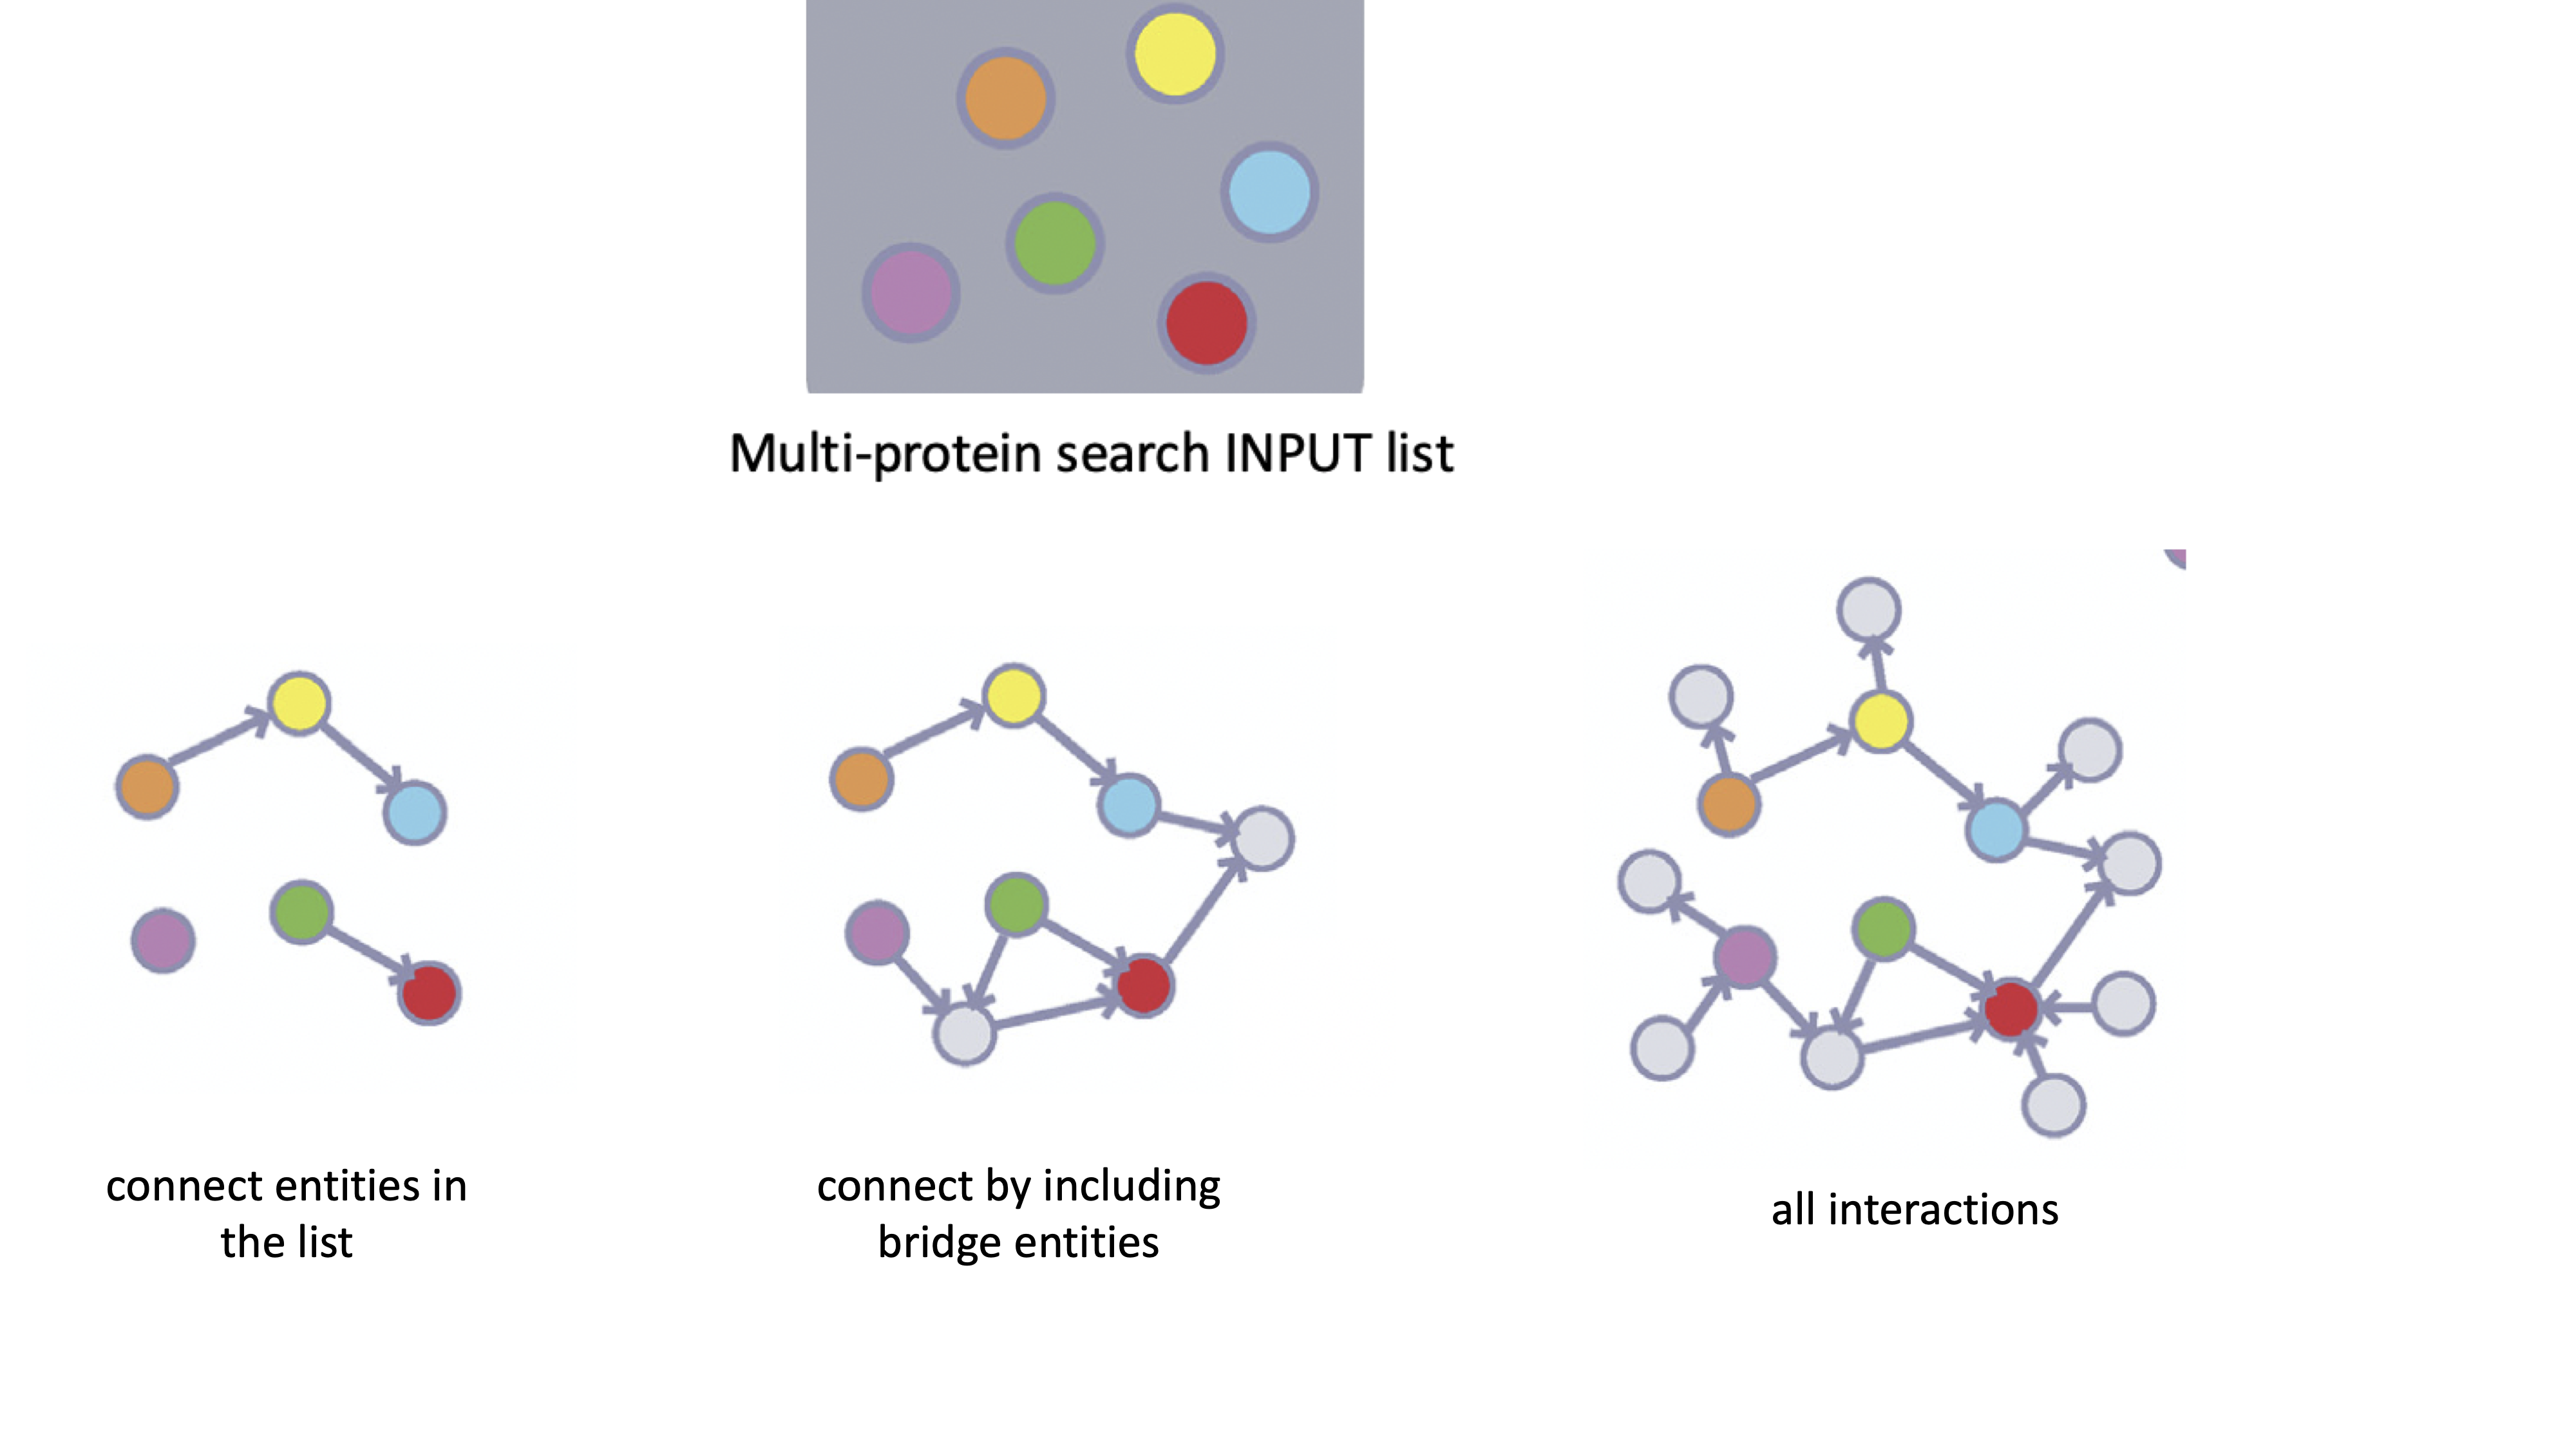
Figure 5 Classical SIGNOR query types. The ‘connect entities in the list’ search retrieves interactions between the entities in the input. The ‘connect by including bridge entities’ retrieves interaction between the entities in the input, including proteins necessary to connect them in two steps. The ‘all interactions’ search retrieves any interaction involving the proteins in the input.
To use this query mode, you should go to Control Panel –> Network–> SIGNOR entity query and connect, then you can click on and then Select the appropriate query type and Species (Fig.6).
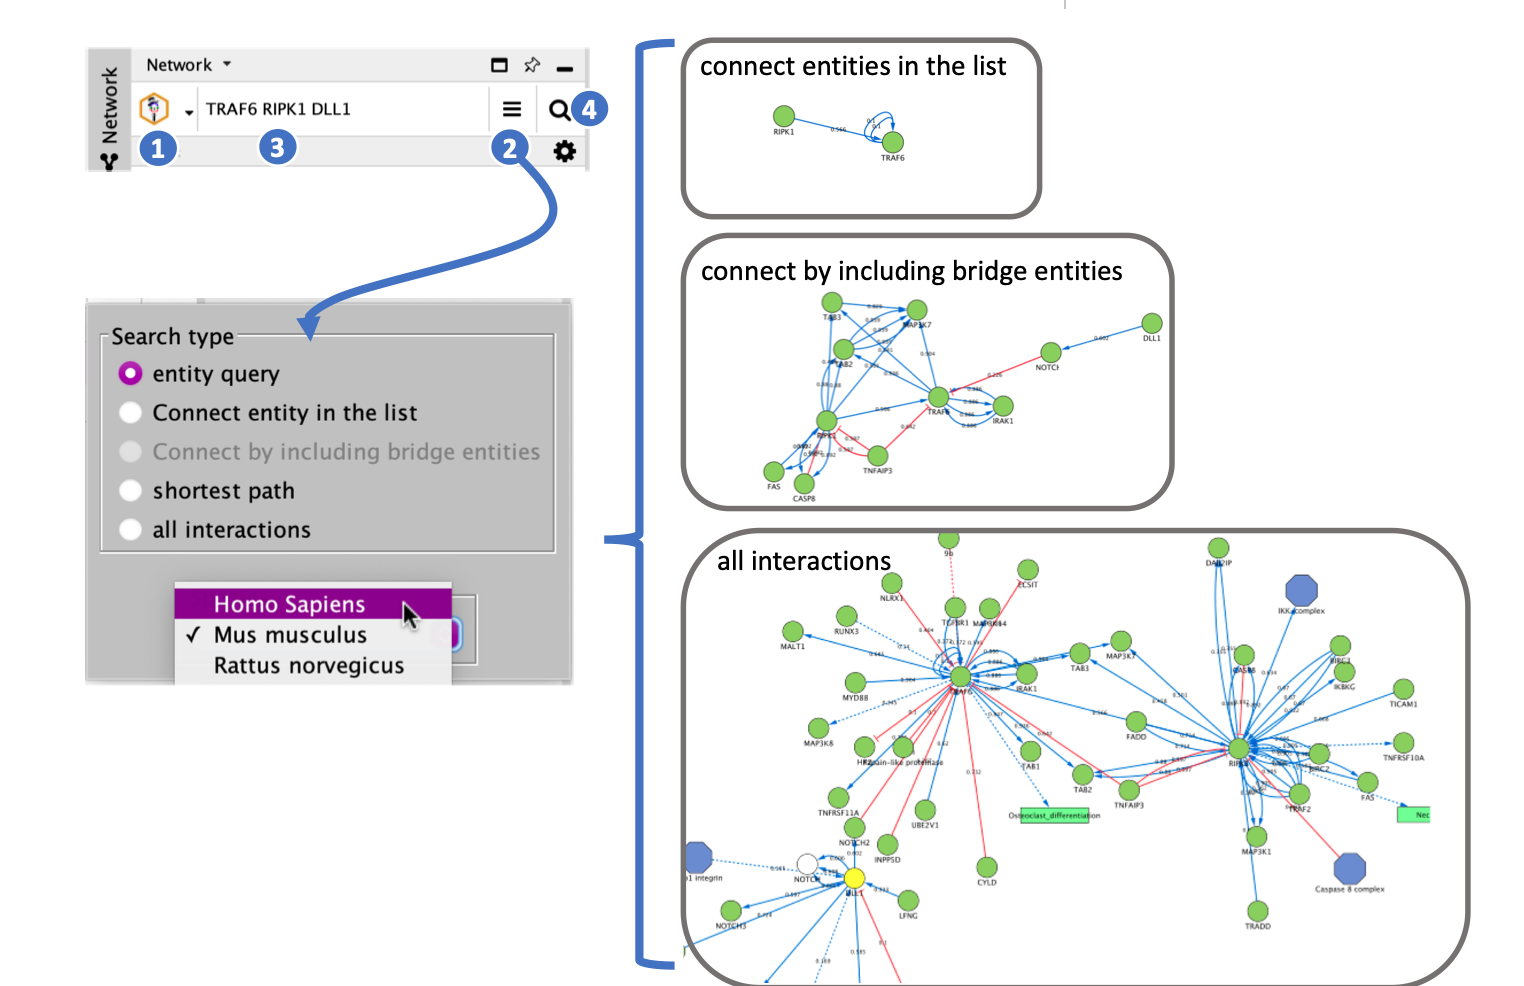
Now, you can enter the list of terms you want to search inside the search bar. Multiple entities can be separated by space or return. It can be a list of entity names (e.g. ‘TRAF6 RIPK1 DLL1’) or a list of identifiers (e.g. ‘Q9Y4K3 O00548 Q13546’). In addition, you can provide or change search options by clicking on .
When your query is ready, click on or press Ctrl + Enter (Cmd + Enter on MacOS) (Fig. 6).
The results page is organized as described in Figure 4.
Figure 6 Example of a multiple entities queries for the protein list: ‘TRAF6, RIPK1, DLL1’. To perform a multiple entities query (1) make sure you have selected the ‘SIGNOR entity query and connect’ option in the control panel (Orange icon); (2) make sure you have selected the type of query you want to visualize, by choosing ‘connect entities in the list’, ‘connect by including bridge entities’ or ‘all interactions’. Also, the species of interest should be selected; (3) type the query in the search box (e.g. ‘TRAF6, RIPK1, DLL1’); (4) launch the query by clicking on the magnifier symbol.
To use this query mode, you should go to Control Panel –> Network–> SIGNOR entity query and connect, then you can click on and then Select the ‘shortest path’ radio button and the Species from the drop-down menu (Fig.2).
Now, you can enter the list of terms you want to search inside the search bar, they MUST be only two entities and can be either separated by space or return. The entities can be provided as names (e.g. ‘DLL1 RIPK1’) or a list of identifiers (e.g. ‘O00548 Q13546’).When your query is ready, click on or press Ctrl + Enter (Cmd + Enter on MacOS) (Fig. 7).
The results page is organized as described in Figure 4.
Signor Pathway query
This search type allows users to browse manually annotated pathways that are classified in four groups: ‘Pathway’, ‘Disease Pathway’, ‘Tumor Pathway’ and ‘COVID’.
To use this query mode, you should go to Control Panel –> Network–> SIGNOR pathway query. Next you can click on and Select the desired pathway under the appropriate classification group (Fig.7).
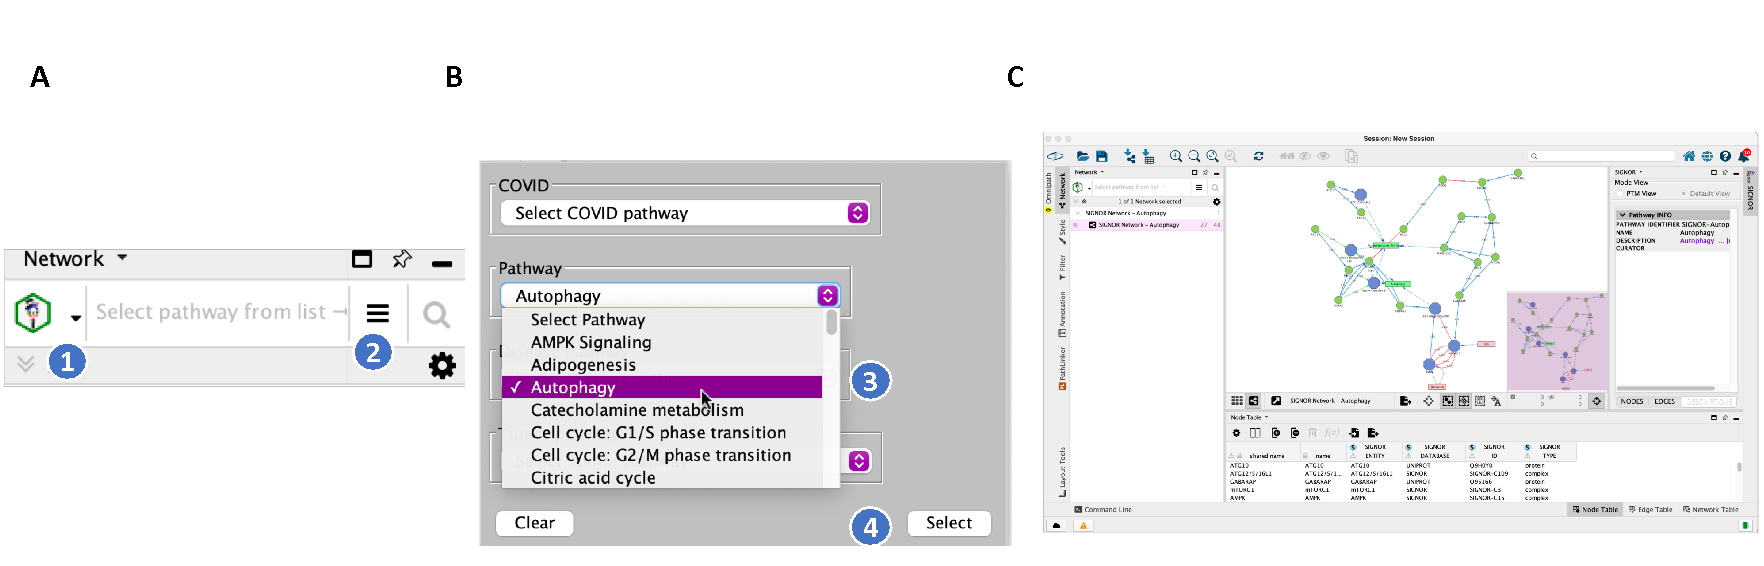
An example of ‘Pathway query’ is provided in Figure 7, for the pathway ‘Autophagy’.
Figure 7 Example of a ‘pathway query’ for ‘Autophagy’. To perform a ‘pathway query’ (1) make sure you have selected the ‘SIGNOR pathway query’ option in the control panel (Green icon); (2) make sure you have accessed the option box; (3) select the ‘Autophagy’ pathway under the appropriate category; (4) launch the query by clicking on ‘select’ to visualize the result.
SIGNOR Interactome query
This query mode permits to retrieve the full interactome of causal interactions annotated in SIGNOR and visualize it in a ‘default view’ mode (Fig. 8C). Data is available for H. sapiens only.
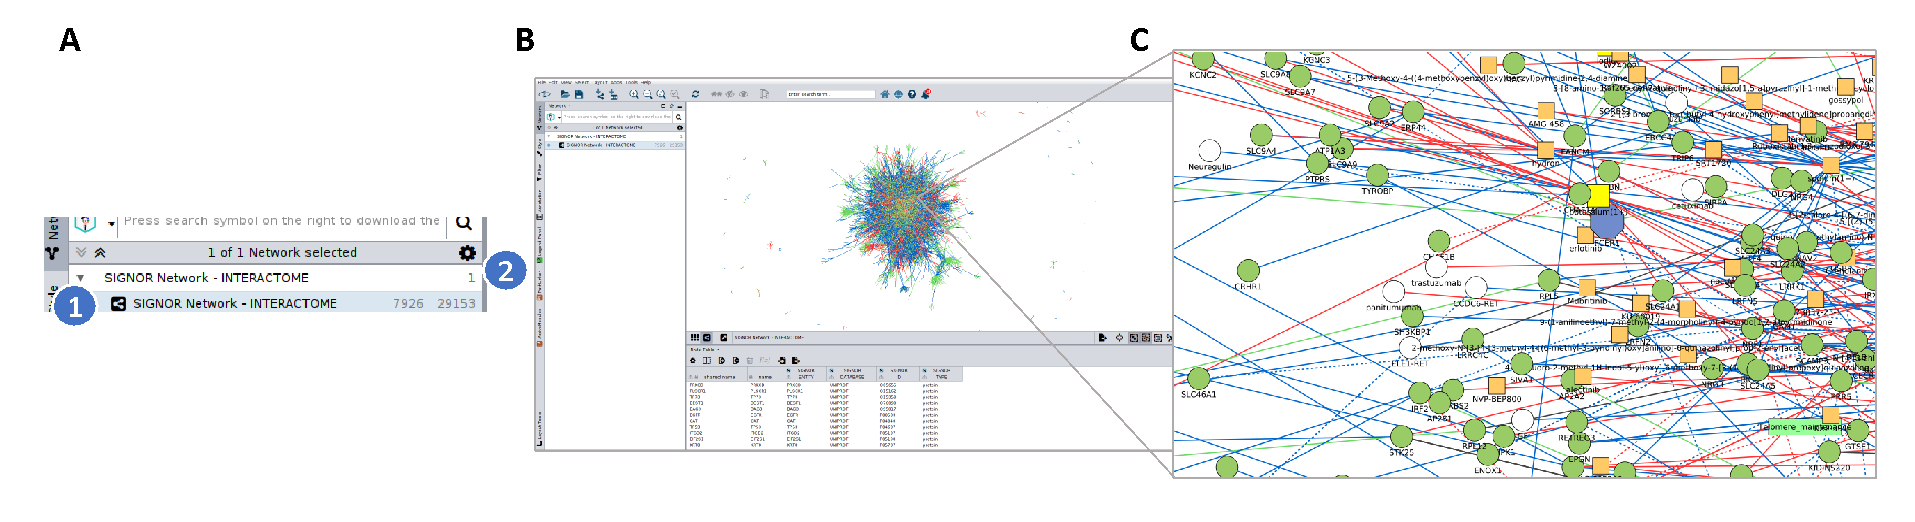
To use this query mode, you should go to Control Panel –> Network–> SIGNOR Interactome query. Next, click on to visualize the result (Fig.8). No result panel is available.
Figure 8 Example of a ‘SIGNOR interactome query’. To perform a ‘SIGNOR interactome query’ (1) make sure you have selected the ‘SIGNOR interactome query’ option in the control panel (Blue icon) (2) launch the query by clicking on the magnifier icon to visualize the result.
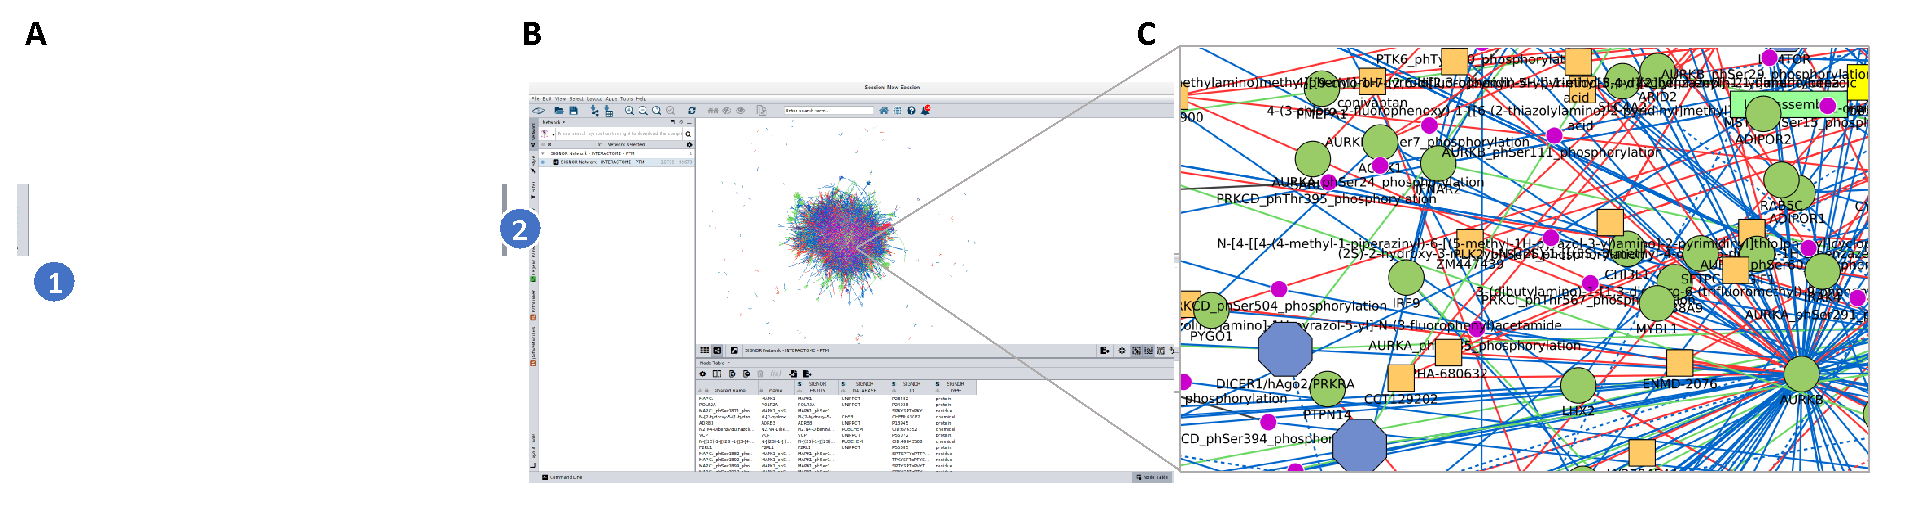
SIGNOR Interactome with PTM query
This query mode permits retrieving the full interactome of causal interactions annotated in SIGNOR and visualizes it in the ‘PTM view’ mode. The ‘PTM view’ mode is fully described in the Sections PTM view and PTM decomposition. For this search type, data is available for H. sapiens, exclusively.
To use this query mode, you should go to Control Panel –> Network–> SIGNOR Interactome query with PTM, then you can click on to visualize the result (Fig.9). No result panel is available.
Figure 9 Example of a ‘SIGNOR interactome query with PTM’. To perform a ‘SIGNOR interactome query with PTM’ (1) make sure you have selected the ‘SIGNOR interactome query with PTM’ option in the control panel (Pink icon) (2) launch the query by clicking on the magnifier icon to visualize the result. Modified residues are shown as small violet circles
Visualization modes and legends
The SIGNORApp offers two visualization modes: the ‘default view’ and the ‘PTM view’. For the ‘SIGNOR entity query and connect’ and the ‘SIGNOR pathway query’ you can switch between the two modes by selecting the appropriate radio button which appears in the Result panel of a query (see Fig. 4-5).
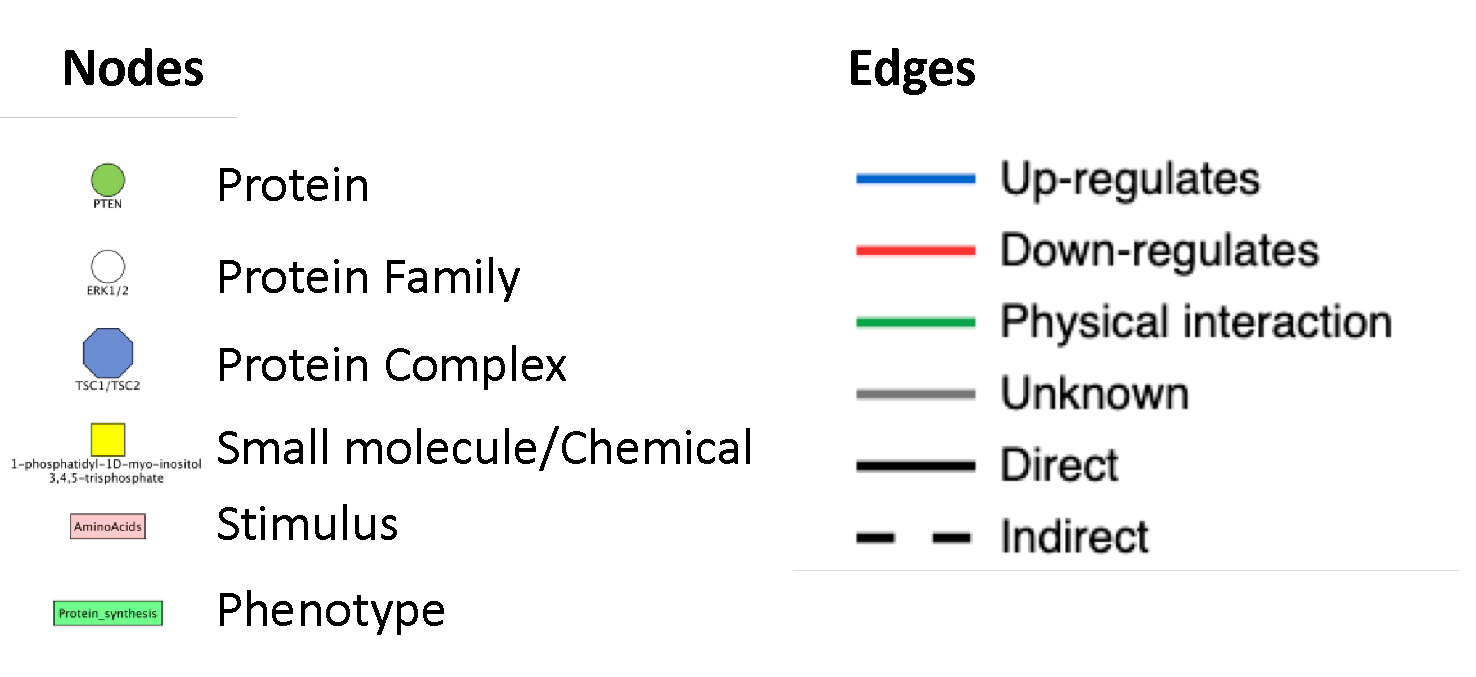
Default view
The default view has been conceived to mirror the visual properties of SIGNOR graph viewer, as presented in the web resource.
The style for the nodes and edges is summarized in Figure 10.
Figure 10 Network Legend, ‘Default view’.
To find all the visualization properties you can go to Control Panel –> Style–> SIGNOR_NS_0.2, then you can click on and then select ‘Create Legend…’
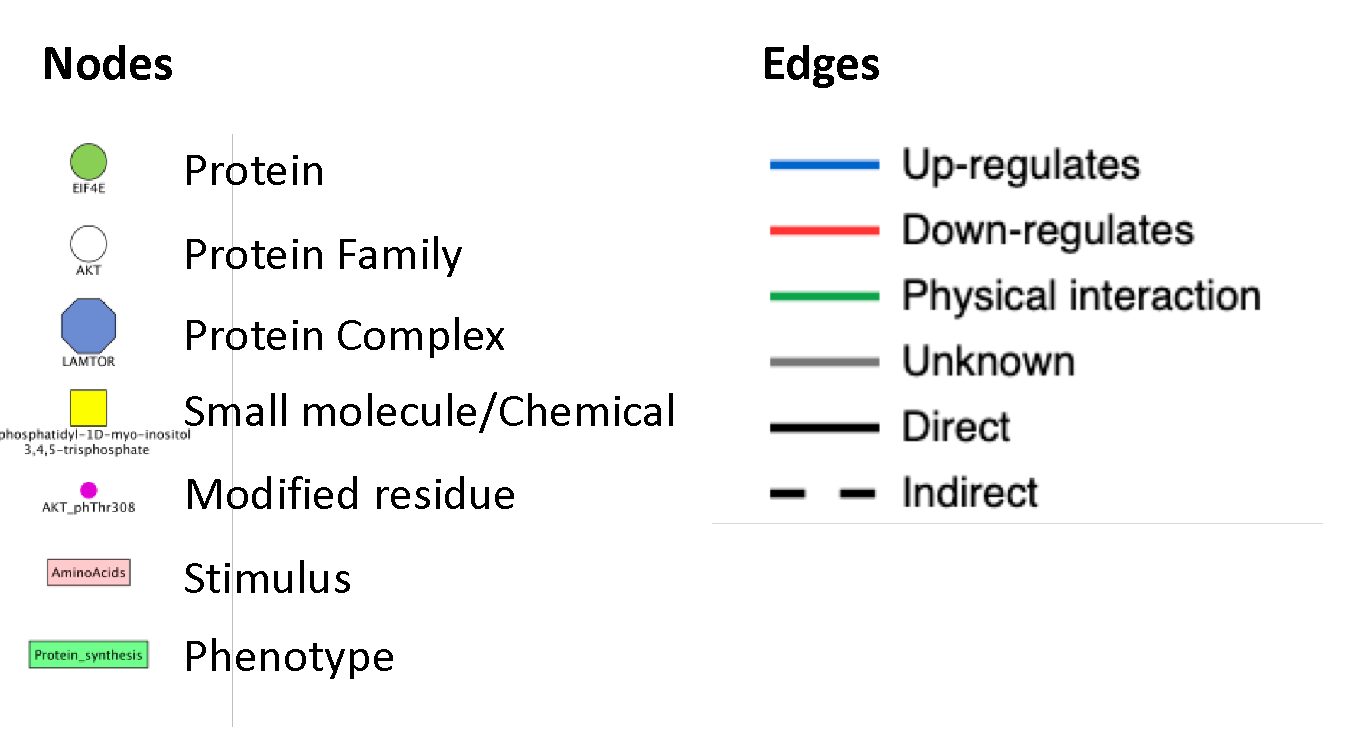
PTM view
The PTM view has been conceived to specifically map the post-translational modifications at the residue level and to highlight their regulatory role (PTMs) .
The nomenclature for PTM is provided in Table 1. The criteria adopted to show PTMs is fully described in the Section PTM decomposition.
The style for the nodes and edges is summarized in Figure 11.
Figure 11 Network Legend, ‘PTM view’.
To find all the visualization properties you can go to Control Panel –> Style–> SIGNOR_NS_0.2 and click on to select ‘Create Legend…’
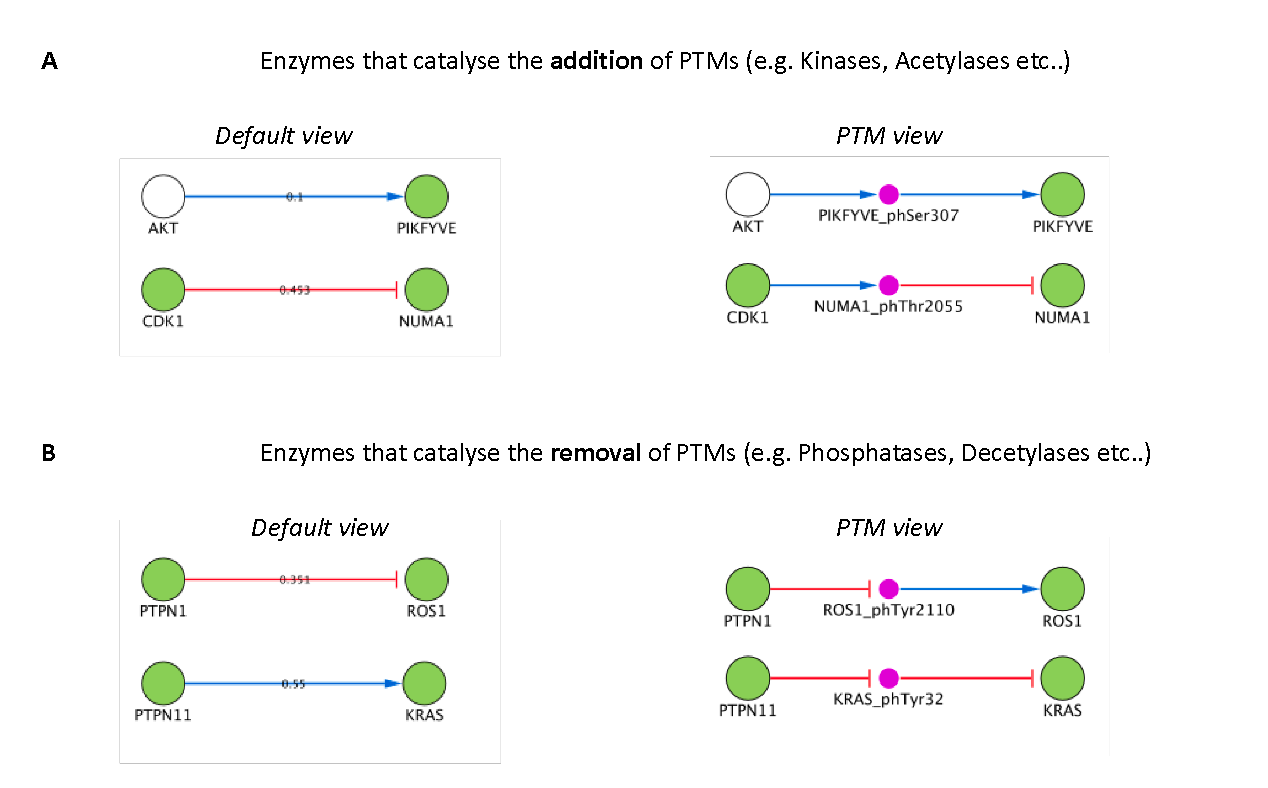
PTM decomposition
The ‘PTM view’ mode is conceived to highlight the regulatory role of post-translational modifications. This view mode is allowed exclusively for those interactions that are annotated with details about the amino acid residue that is the target of the addition or the removal of a PTM (e.g. a phosphorylation, an acetylation etc…).
Briefly, in the PTM mode, modified residues are represented as independent nodes linked to the protein node they belong to. As shown in Figure 12, the residue node name (e.g. NUMA1_phThr2055) is obtained by joining 1) the gene name of the protein substrate (to which the residue belongs: ‘NUMA1’); 2) the type of modification (indicated by an abbreviation: ‘ph’ -> phosphorylation); and 3) the position of the modified residue (‘Thr2055’). The complete list of PTM abbreviation is provided in Table 1.
|
MODIFICATION |
ABBREVIATION |
|
acetylation |
ac |
|
carboxylation |
car |
|
cleavage |
cle |
|
glycosylation |
gly |
|
hydroxylation |
hyd |
|
methylation |
met |
|
neddylation |
ned |
|
palmitoylation |
pal |
|
phosphorylation |
ph |
|
sumoylation |
sum |
|
ubiquitination |
ub |
Once the residue node is generated, the enzyme-substrate interaction is modelled as two sub-interactions (Fig. 12):
Figure 12 shows how the two sub interactions are generated.
Step-by-step tutorial to map phosphoproteomic results onto SIGNOR data
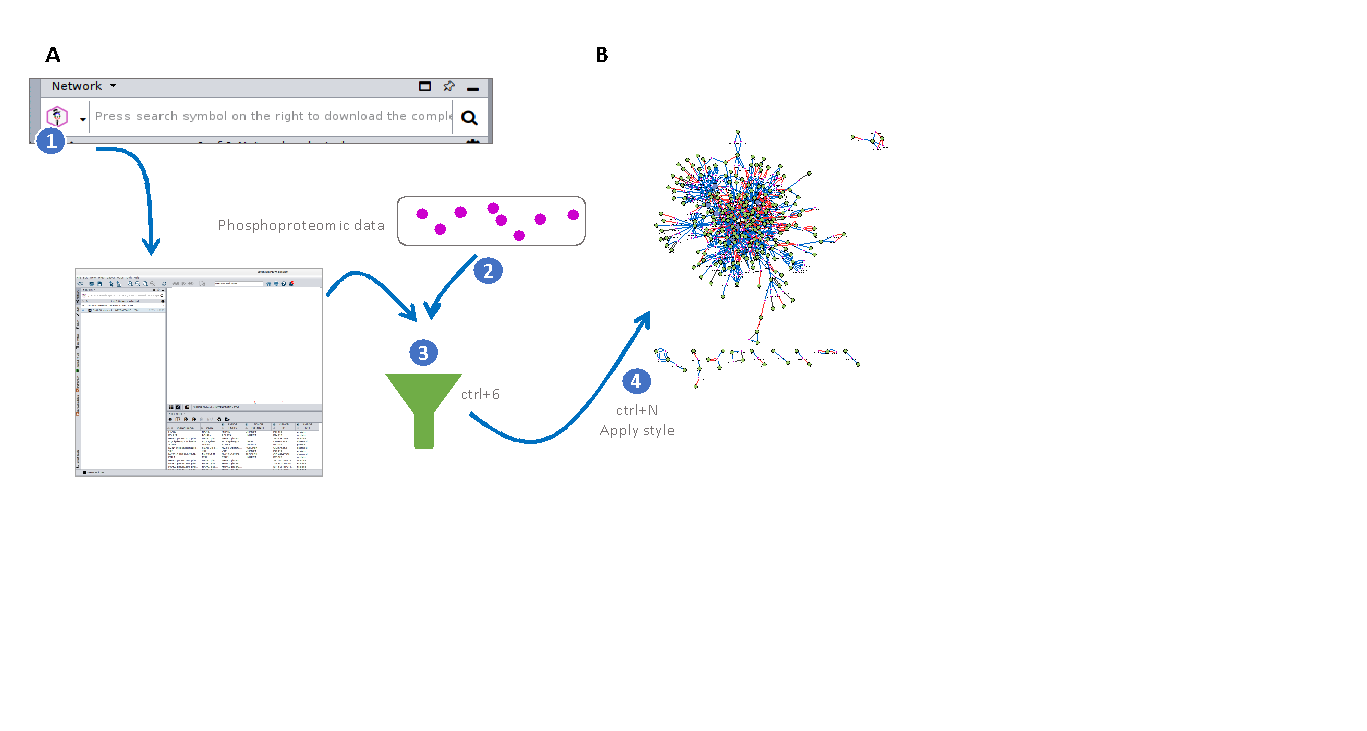
We here show the workflow to map phosphoproteomic data onto SIGNOR interactions. We aim to show how the SIGNORApp can be used to provide a framework that helps interpreting phosphoproteomic studies (e.g. the perturbation of the phosphoprofile modulated by drug treatment). The general workflow is illustrated in Figure 13, briefly 1) you can use the SIGNOR Interactome with PTM query functionality to download the complete SIGNOR interactome; 2) next, by using Cytoscape built-in functions, you can select the phosphorylation sites significantly modulated in the experimental condition (e.g. Sacco et al., 2016) and 3) you can expand the selection to include neighbor nodes, corresponding to kinases/phosphatases and protein substrates; 4) you can, thus, obtain a subnetwork representing the phosphorylation cascade underlying the experimental condition.
Figure 13 Step-by-step tutorial to map phosphoproteomic results onto SIGNOR data. (1) Go to ‘SIGNOR interactome query with PTM’, make sure you have selected the ‘SIGNOR interactome query with PTM’ option in the control panel (Pink icon) and launch the query by clicking on the magnifier icon to visualize the result. (2) Select the phosphorylation sites. (3) Use Ctrl+ 6 to select first neighbors. (4) Use Ctrl+N to create a subnetwork.
Step0: prepare the input data
The input of the pipeline is the phosphoproteomic dataset. You need to process the data to produce, for each phosphorylation site, the string ‘
Step 1: use the ‘SIGNOR Interactome with PTM query’ functionality to download the complete SIGNOR interactome
This query mode permits retrieving the full interactome of causal interactions annotated in SIGNOR and visualizes it in the ‘PTM view’ mode (please visit ‘SIGNOR Interactome with PTM query for further detail’).
Warning: the network is not shown by default because it is too large and it might reduce the speed of the application, we suggest not to visualize the network at this stage.
Step2: select the phosphorylation sites significantly modulated upon metformin treatment
To select significantly modulated phosphorylation sites, you can go to Select -> Nodes -> From ID list file… and chose the file ‘input.txt’.
Step3: expand the selection to include neighbor nodes
To expand the selection and to incorporate in the network also kinases/phosphatases and protein substrates, you can go to Select -> Nodes -> First Neighbors of Selected Nodes -> Undirected or, in alternative, you can press Ctrl + 6 (Cmd + 6 on MacOS).
Step 4: create the subnetwork
To create the subnetwork representing the phosphorylation cascade triggered by metformin, you can go to File -> New Network -> From Selected Nodes, All Edges or, in alternative, you can press Ctrl + N (Cmd + N on MacOS).
Warning: the network might have no style. To use SIGNOR style, please go to Style and select SIGNOR_NS_0.2.